


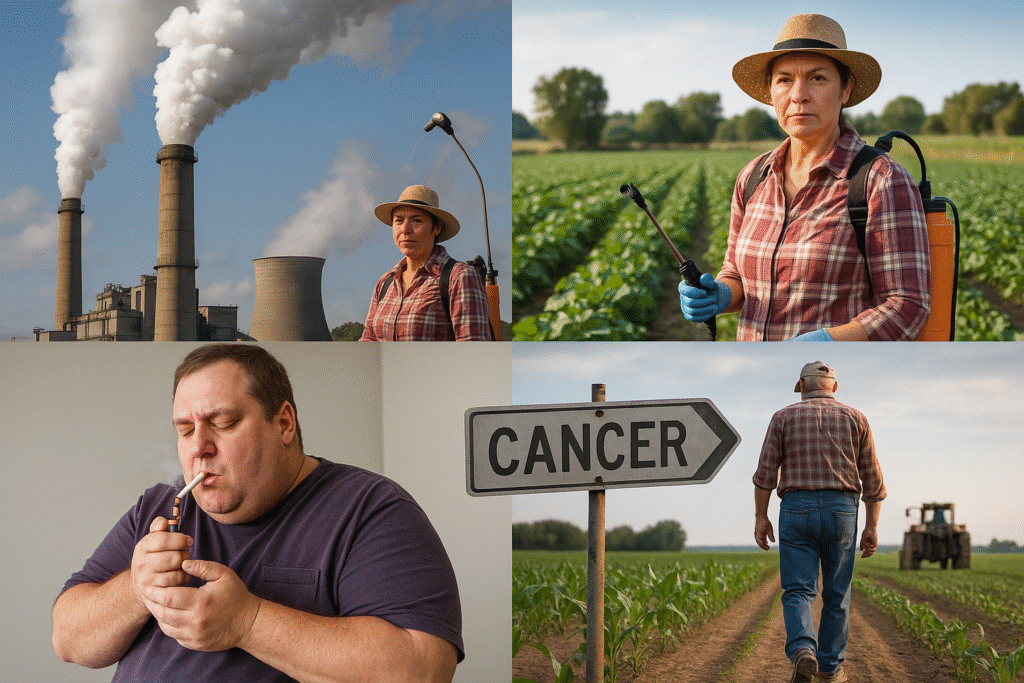
Why Cancer Rates In Midwest Are Higher: multiple, overlapping causes — environmental exposures (radon, pesticides, PFAS), higher adult obesity and tobacco prevalence in parts of the region, occupational risks from manufacturing/agriculture, and structural factors such as rural health-care access and socio-economic disparities — help explain why many Midwestern states show some of the nation’s highest cancer incidence and/or cancer mortality rates. The situation is complex: different cancers have different drivers, and ‘higher rates’ for the Midwest are best understood as the product of many small and large risk differences over time.
Why this matters (Why Cancer Rates In Midwest Are Higher)
Cancer incidence and death rates vary across the U.S. for reasons that are partly preventable and partly structural. Understanding why the Midwest often appears toward the top of national cancer maps helps communities target prevention, testing, and policy changes. National surveillance and research point to several repeatable patterns.
1) The data: yes — some Midwestern states have higher cancer rates
Federal surveillance tools (USCS, NCI/State Cancer Profiles) show that several Midwest states rank among the highest in age-adjusted incidence or mortality for “all cancers combined” across recent multi-year windows. These official tables — which aggregate many years of registry data — are the best starting point for comparisons.
Takeaway: the pattern is real in the data, but it is not one simple “Midwest = one cause.” Different counties and states show different cancer types and drivers.
2) Radon — a silent, geological contributor in many Midwestern homes
Radon is a naturally occurring radioactive gas that comes from soil and rock and accumulates indoors. Midwest geology — glacial deposits and bedrock in many states — creates widespread areas with elevated indoor radon potential. The EPA radon zone maps and recent high-resolution radon research confirm that tens of millions of Americans are exposed to potentially elevated radon, with many Midwestern counties among the higher-risk areas. Chronic radon exposure increases lung cancer risk, particularly among non-smokers.
Practical reader tip: test your home for radon (simple test kits exist) and remediate if levels are high. That’s one of the most direct individual actions to reduce a preventable cancer risk.
3) Agricultural pesticide exposure — higher use, measurable links to certain cancers
Midwest states produce large shares of U.S. corn, soy and other commodity crops, and consequently have higher per-area pesticide application in many counties. A growing body of epidemiologic research links certain pesticide exposures to elevated risks of cancers such as non-Hodgkin lymphoma, leukemia, bladder and others. Recent regional analyses (including peer-reviewed and preprint research through 2024–2025) report associations between pesticide-use patterns and increased cancer incidence in agricultural Midwest counties.
Context: regulation and labeling vary, and exposure is highest among farmworkers and families in agricultural communities. Policy and workplace protections are key levers.


4) “Forever chemicals” (PFAS) and industrial contamination near the Great Lakes and elsewhere
PFAS (per- and polyfluoroalkyl substances) show up across the Great Lakes basin and in groundwater and air in many industrial and post-industrial areas. PFAS exposure has been associated with increased risk for certain cancers (kidney, testicular) and other serious health problems. The Great Lakes and adjacent Midwestern watersheds have been a focus of PFAS detection studies, which helps explain part of the regional environmental burden.
Action point: community water testing, remediation funding, and stricter industrial controls are public-health levers that states are pursuing with federal support.
5) Behavioral risk factors: tobacco, obesity, and alcohol
Tobacco and obesity remain two of the largest preventable drivers of cancer across the U.S. Many Midwestern states have adult smoking and obesity rates among the nation’s higher values; obesity prevalence maps and state BRFSS surveillance confirm a Midwest/South clustering for excess obesity. These behaviors increase the risk for multiple cancers (lung, colorectal, pancreatic, breast in post-menopausal women, liver, and more).
Public health programs targeting smoking cessation, healthy food access, and physical activity can shift these long-term population risks.
6) Occupational exposures and legacy industry
Midwestern economies include manufacturing, mining, heavy industry, and large agricultural workforces. Occupational exposures (asbestos, diesel exhaust, certain industrial solvents) are classically linked to higher rates of specific cancers (lung, mesothelioma, bladder). Even when those industries decline, legacy contamination in soil and buildings can sustain long-term exposure risks.
Worker protections, remediation of contaminated sites, and surveillance of occupational illnesses are critical policy areas to reduce occupational-related cancer burden.
7) Rural health care access, screening, and late diagnosis
Large parts of the Midwest are rural. Rural populations often face long travel distances to screening and specialty care, fewer oncologists per capita, and lower health insurance continuity. These access gaps can produce both higher mortality and later-stage diagnosis, which shows up in county-level mortality and geospatial analyses. The result: some Midwestern counties see worse cancer outcomes even where incidence may be similar.
Local solutions include mobile screening units, tele-oncology, and targeted workforce incentives to place clinicians in underserved counties.

8) Socioeconomic and racial/ethnic disparities
Socioeconomic status, education, and other social determinants are strongly linked to cancer risk and outcomes. Regions with higher poverty, lower insurance coverage, and lower educational attainment tend to have higher cancer mortality and sometimes higher incidence for certain cancers. Geospatial studies identify “hot spots” where social determinants compound environmental and behavioral risks. Addressing those root causes requires cross-sector policy (housing, education, healthcare).
9) Surveillance, reporting, and the “diagnosis effect”
Part of the observed variation between states comes from differences in screening uptake and registry completeness. Places with robust screening programs can record higher short-term incidence (since more cancers are found) while ultimately reducing mortality. Conversely, lower screening rates can delay diagnosis and raise death rates. Official cancer registries (USCS, SEER, State Cancer Profiles) smooth some of those differences when reporting multi-year age-adjusted rates, but interpretation still requires caution.
Putting the pieces together — a short synthesis
No single cause explains the Midwest pattern. Rather, overlapping exposures (radon + occupational + pesticide), higher prevalence of certain risk behaviors (smoking, obesity), structural factors (rural access, socioeconomic disadvantage), and region-specific contaminants (PFAS, legacy industrial pollution) combine to push rates up for some cancers and in some places. Geospatial analyses and public-health surveillance consistently point to these interacting causes as the main drivers.
What this means for communities and individuals
- Test and fix radon in homes, especially in older or basement-heavy houses. Radon remediation is effective and affordable relative to health benefits.
- Support local water testing and PFAS remediation programs if you live near industrial sites or downstream of treatment plants.
- Protect farmworkers: advocate for stricter pesticide safety training, buffer zones, and take-home exposure prevention.
- Quit smoking & manage weight: individual risk reductions have large population health effects. Use state cessation programs and community services.
- Get screened: follow USPSTF and CDC screening guidance for colorectal, cervical, breast and lung screening (if eligible). Early detection saves lives.
How public policy can reduce Midwest cancer burden
Policy levers include funding rural health clinics and mobile screening, strengthening worker protections, tighter controls and monitoring of pesticides and PFAS, expanding radon awareness and mitigation incentives, and investing in preventive health (smoking cessation, obesity prevention). Multi-agency coordination (EPA, CDC, state health departments, agricultural agencies) is necessary because exposures are environmental, occupational and behavioral.
Final thoughts
Understanding why cancer rates Midwest are higher is not about assigning blame to one industry or behavior. It’s about recognizing a stack of risk factors — geological, environmental, occupational, behavioral and structural — that summed together increase population risk in many Midwestern counties and states.
Good public policy, funded community health programs, workplace protections, environmental remediation and everyday prevention steps (testing homes for radon, getting screened, quitting smoking) can meaningfully lower the burden. The evidence base to guide these actions is growing and actionable right now.
Disclaimer: This article synthesizes peer-reviewed studies, federal surveillance data, and reputable journalism available as of October 31, 2025. It is for informational purposes and not personalized medical advice. For personal cancer risk, screening schedule, or exposure concerns, consult your physician or your state public health department.
Verified external links
(Each link below was live and authoritative at the time this post was prepared.)
- U.S. Centers for Disease Control and Prevention — United States Cancer Statistics (USCS): https://www.cdc.gov/united-states-cancer-statistics/index.html. (cdc.gov)
- NCI / State Cancer Profiles — Incidence Rate Tables (All Cancers, by State): https://statecancerprofiles.cancer.gov/incidencerates/index.php. (statecancerprofiles.cancer.gov)
- EPA — Map of Radon Zones (and guidance on testing/remediation): https://www.epa.gov/radon/epa-map-radon-zones. (epa.gov)
- PNAS (2025) — High-resolution radon exposure maps and analysis: https://www.pnas.org/doi/10.1073/pnas.2408084121. (PNAS)
- Frontiers / Cancer Control & Society (2024) — Pesticide use patterns and cancer associations: https://www.frontiersin.org/journals/cancer-control-and-society/articles/10.3389/fcacs.2024.1368086/full. (Frontiers)
- ScienceDirect / Environmental Research (PFAS studies) & coverage in major outlets — PFAS contamination in Great Lakes basin: https://www.sciencedirect.com/science/article/abs/pii/S0048969724034727 and reporting (e.g., The Guardian). (sciencedirect.com)
- CDC — Behavioral Risk Factor Surveillance System (BRFSS) / State fact sheets (tobacco, obesity): https://www.cdc.gov/brfss/brfssprevalence/index.html and https://www.cdc.gov/obesity/data-and-statistics/adult-obesity-prevalence-maps.html. (cdc.gov)
- CDC/PCD (2024) — Geospatial hot spots and disparities in cancer death rates: https://www.cdc.gov/pcd/issues/2024/24_0046.htm. (cdc.gov)
- National Cancer Institute / SEER — Cancer Stat Facts and SEER overview: https://seer.cancer.gov/statfacts/html/all.html. (SEER)