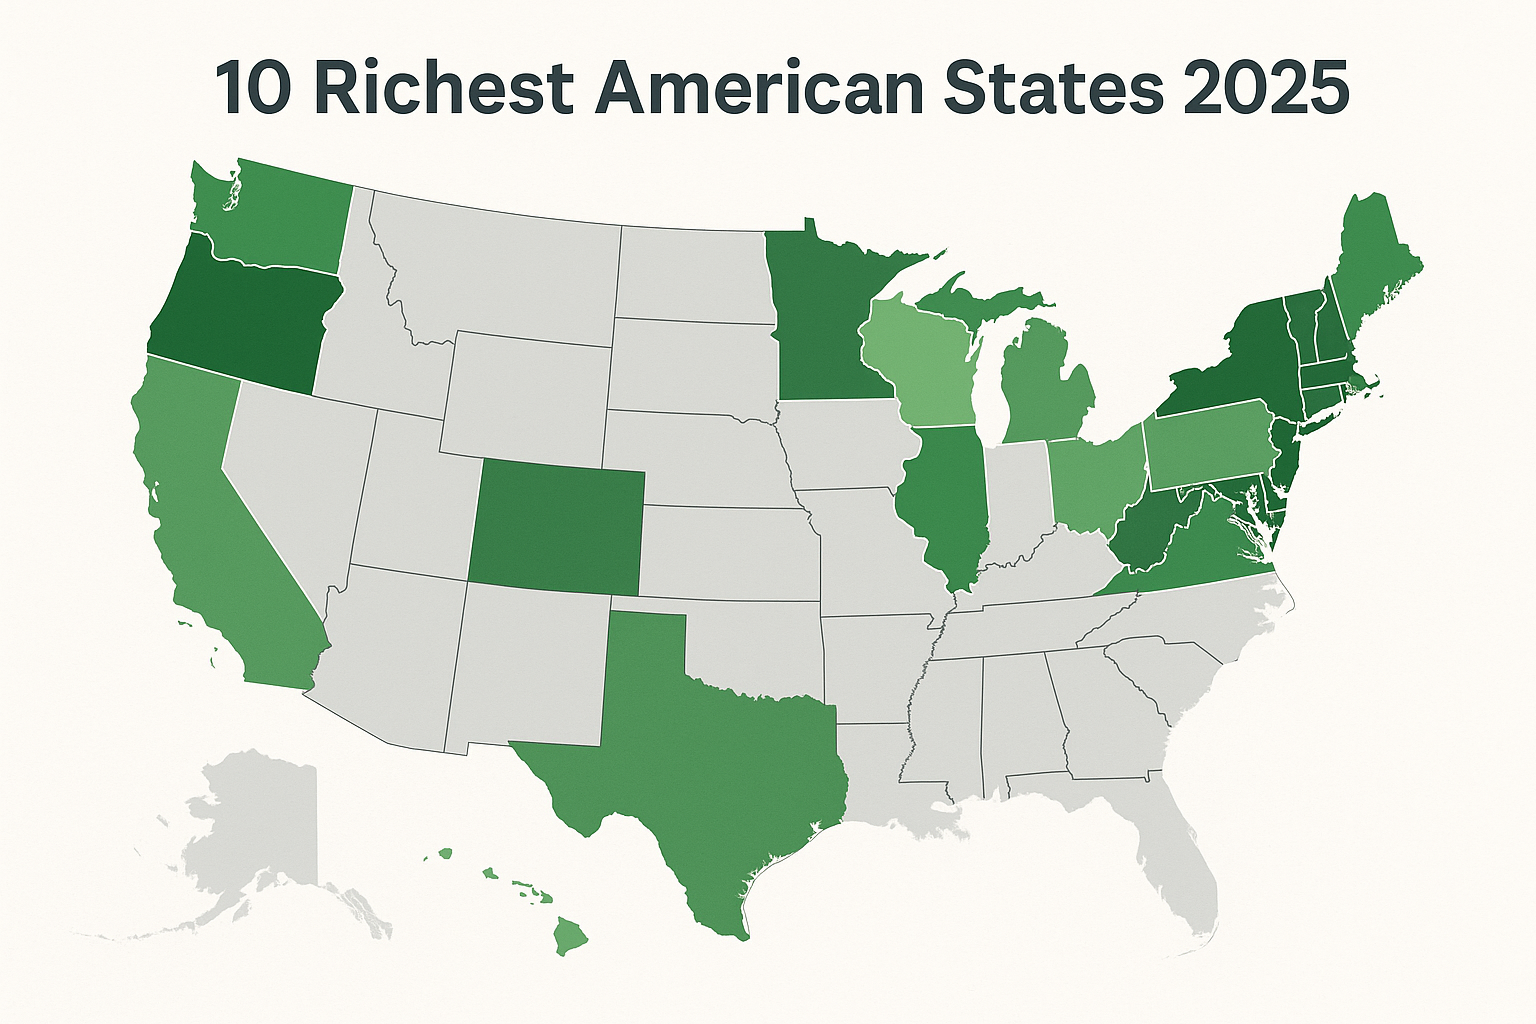
Top 10 Richest American States 2025: “Richest” can be measured in several ways; this post uses median household income (the best single indicator of the typical household’s earnings) from the latest U.S. Census data as the primary ranking metric. For each Top-10 state I provide the median income figure (2023 dollar value) and a concise explanation of the structural reasons — industries, geography, federal payrolls or other local advantages — that push each state into the Top 10.
Methodology (short)
- Metric used: Median household income (U.S. Census — American Community Survey, 2023).
- Why median? Median shows the “typical” household and is less skewed by a small number of extremely wealthy households than a mean would be.
- Date: Rankings and commentary are current as of Sept 2025 and interpret the latest available Census/BEA summaries.
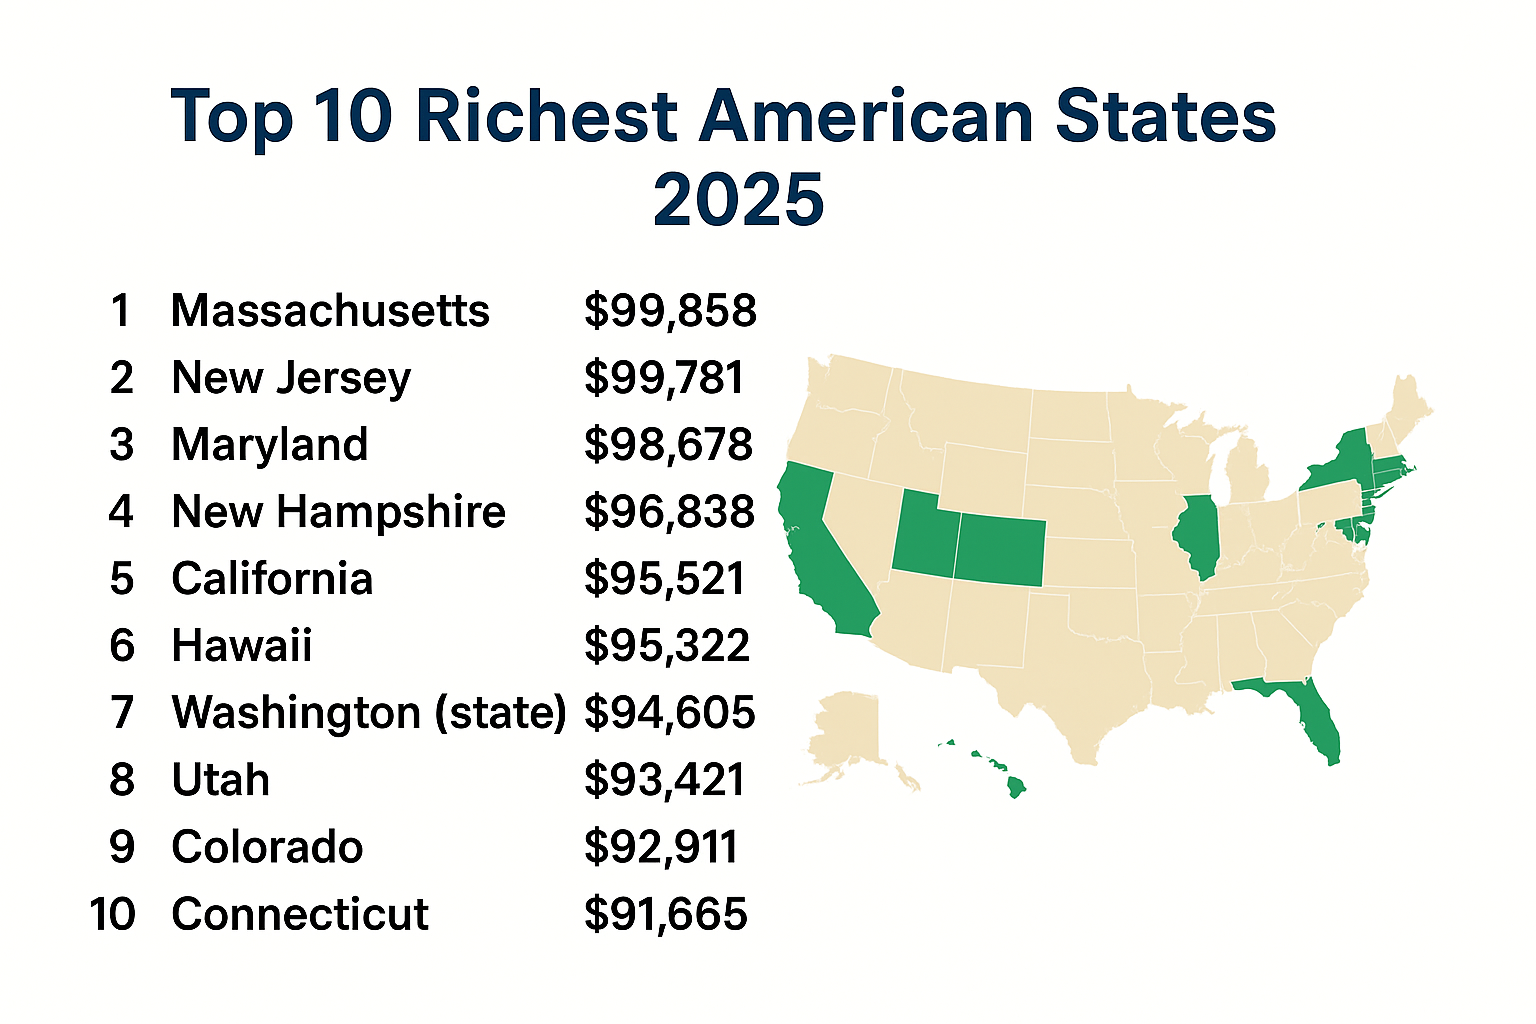
The Top 10 — Ranked by median household income (Census, 2023)
1. Massachusetts — $99,858
Why: Boston’s dense cluster of universities, biotech, health systems, finance and tech firms creates many high-paying professional jobs. High educational attainment and strong professional services push typical household incomes to the top.
2. New Jersey — $99,781
Why: New Jersey benefits from proximity to New York City and Philadelphia. Many households draw high incomes from finance, pharmaceuticals, corporate services and commuter wages in the tri-state economic corridor.
3. Maryland — $98,678
Why: The large federal presence (Washington, D.C. suburbs), defense contractors, and high-tech government services drive above-average wages. Federal payrolls and contracting lift the typical household income.
4. New Hampshire — $96,838
Why: A high share of professional and technical workers, strong suburban incomes near Boston and Manchester-area economic strength give New Hampshire a top median income.
5. California — $95,521
Why: California’s tech hubs, entertainment industry, finance centers and professional services produce high wages in many metros. Note, however, that high housing costs and large internal variation mean purchasing power can vary widely across the state.
6. Hawaii — $95,322
Why: Tourism, significant public and military payrolls, and a smaller population result in a relatively high median household income — but housing and living costs are among the nation’s highest.
7. Washington (state) — $94,605
Why: Seattle-area tech employers, aerospace industry ties and a strong professional-services sector raise wages across the state, lifting the median household income.
8. Utah — $93,421
Why: Rapid growth of technology and software jobs in the “Silicon Slopes,” strong labor-force participation and high household formation rates increase median incomes in Utah.
9. Colorado — $92,911
Why: A mix of tech, aerospace, energy and professional services — combined with in-migration of higher-income workers drawn by lifestyle amenities — has raised incomes, especially in Denver–Boulder and nearby suburbs.
10. Connecticut — $91,665
Why: Financial services and insurance (notably around Hartford and New York suburbs) create pockets of high wages that raise Connecticut’s statewide median.
What unites the Top 10
These states typically combine one or more of the following:
- Strong concentrations of high-paying industries (tech, finance, biotech, professional services).
- High educational attainment and tight labor markets.
- Significant federal payrolls or contractor presence in key metro regions.
- For some smaller states, concentrated economic activity (tourism, military, or resource industries) that raises medians.
Important caveats — cost of living & inequality
- High income ≠ high purchasing power. States like Hawaii and California have very high housing and living costs that reduce the real purchasing power of nominal incomes.
- Median vs mean: A high mean or per-capita number can be pulled up by a small wealthy group and may not reflect the typical household.
- Internal variation: Large states contain wealthy metros and lower-income rural areas; statewide medians smooth over these differences.
Practical tips for readers
- Relocating? Compare median household income with local housing costs and taxes to judge real affordability.
- Job seekers: Top-10 states often have clusters of high-paying jobs, but also steeper costs of living and competition.
- Policymakers: Raising median incomes requires investment in education, workforce training and housing affordability — attracting firms alone is not enough.
Short conclusion
Using the Census’ 2023 medians, the Top 10 richest American states (by median household income) are led by Massachusetts, New Jersey and Maryland. These states’ industry mixes, human capital and geographic advantages elevate the typical household income. Always interpret these rankings with cost-of-living and inequality measures to understand how far incomes go for everyday families.
Sources & further reading
- U.S. Census Bureau — Household Income in States and Metropolitan Areas: 2023 (web page). Official Census summary and tables for median household income by state.
https://www.census.gov/library/publications/2024/acs/acsbr-023.html. (Census.gov) - U.S. Census Bureau — Household Income in States and Metropolitan Areas: 2023 (PDF, full report). Full ACS brief (PDF) with state tables and methodology.
https://www2.census.gov/library/publications/2024/demo/acsbr-023.pdf. (Census) - Bureau of Economic Analysis (BEA) — Personal Income by State. Official BEA pages and tables for personal income and per-capita income (useful complementary data).
https://www.bea.gov/data/income-saving/personal-income-by-state. (Bureau of Economic Analysis) - StatsAmerica — States in Profile (Per Capita Personal Income ranking). Aggregated per-capita personal income rankings and state profiles (derived from BEA).
https://www.statsamerica.org/sip/rank_list.aspx?rank_label=pcpi1. (Stats America)
Disclaimer
This article summarizes publicly available government data and reporting as of September 2025. It is for informational and editorial purposes only and does not constitute financial, legal or relocation advice. For original data consult the U.S. Census Bureau and BEA publications. Images used in this article are royalty‑free or licensed for commercial use and are provided here for illustrative purposes.